Debugging failed Lambda renders
There are four reasons renders may fail:
delayRender().Error in React code
If your code throws an error, you will see the error in the logs. If you are rendering via the CLI, the error will be symbolicated which can help you find the error in your code. Try to fix the error, redeploy the site and re-render.
Understanding which timeout occurred
If your error message reads that a delayRender() call timed out, a function has called delayRender() but did not call continueRender() within the timeout period. This is usually caused by a bug in your code. See Debugging timeout for more tips.
You can increase the timeout by passing timeoutInMilliseconds to renderMediaOnLamba() or passing --timeout to the CLI when rendering a video. Don't confuse it with the --timeout flag for the CLI when deploying a function (see below).
If your error message reads that the main Lambda function has timed out, it means that the render was still ongoing, but the maximum execution duration of the Lambda function has been hit. This is caused by either:
- A render that takes too long to complete within the specified duration. In that case, you should increase the function timeout by passing
--timeoutto the CLI when deploying a function. - A render that has a bottleneck and completes slowly on Lambda. In that case, you should identify the bottleneck by measuring and optimizing the render. See Optimizing for speed for more tips.
- A chunk is getting stuck, making it impossible for the main function to complete the task of concatenating the chunks. You should identify the chunk that is getting stuck by looking at the logs. See below for how to do this.
Inspecting the logs
Add --log=verbose to the Lambda render while rendering via the CLI. This will print a CloudWatch link to the console.
When using renderMediaOnLambda() add logLevel: "verbose" as an option. You will get a cloudWatchLogs field in the return value.
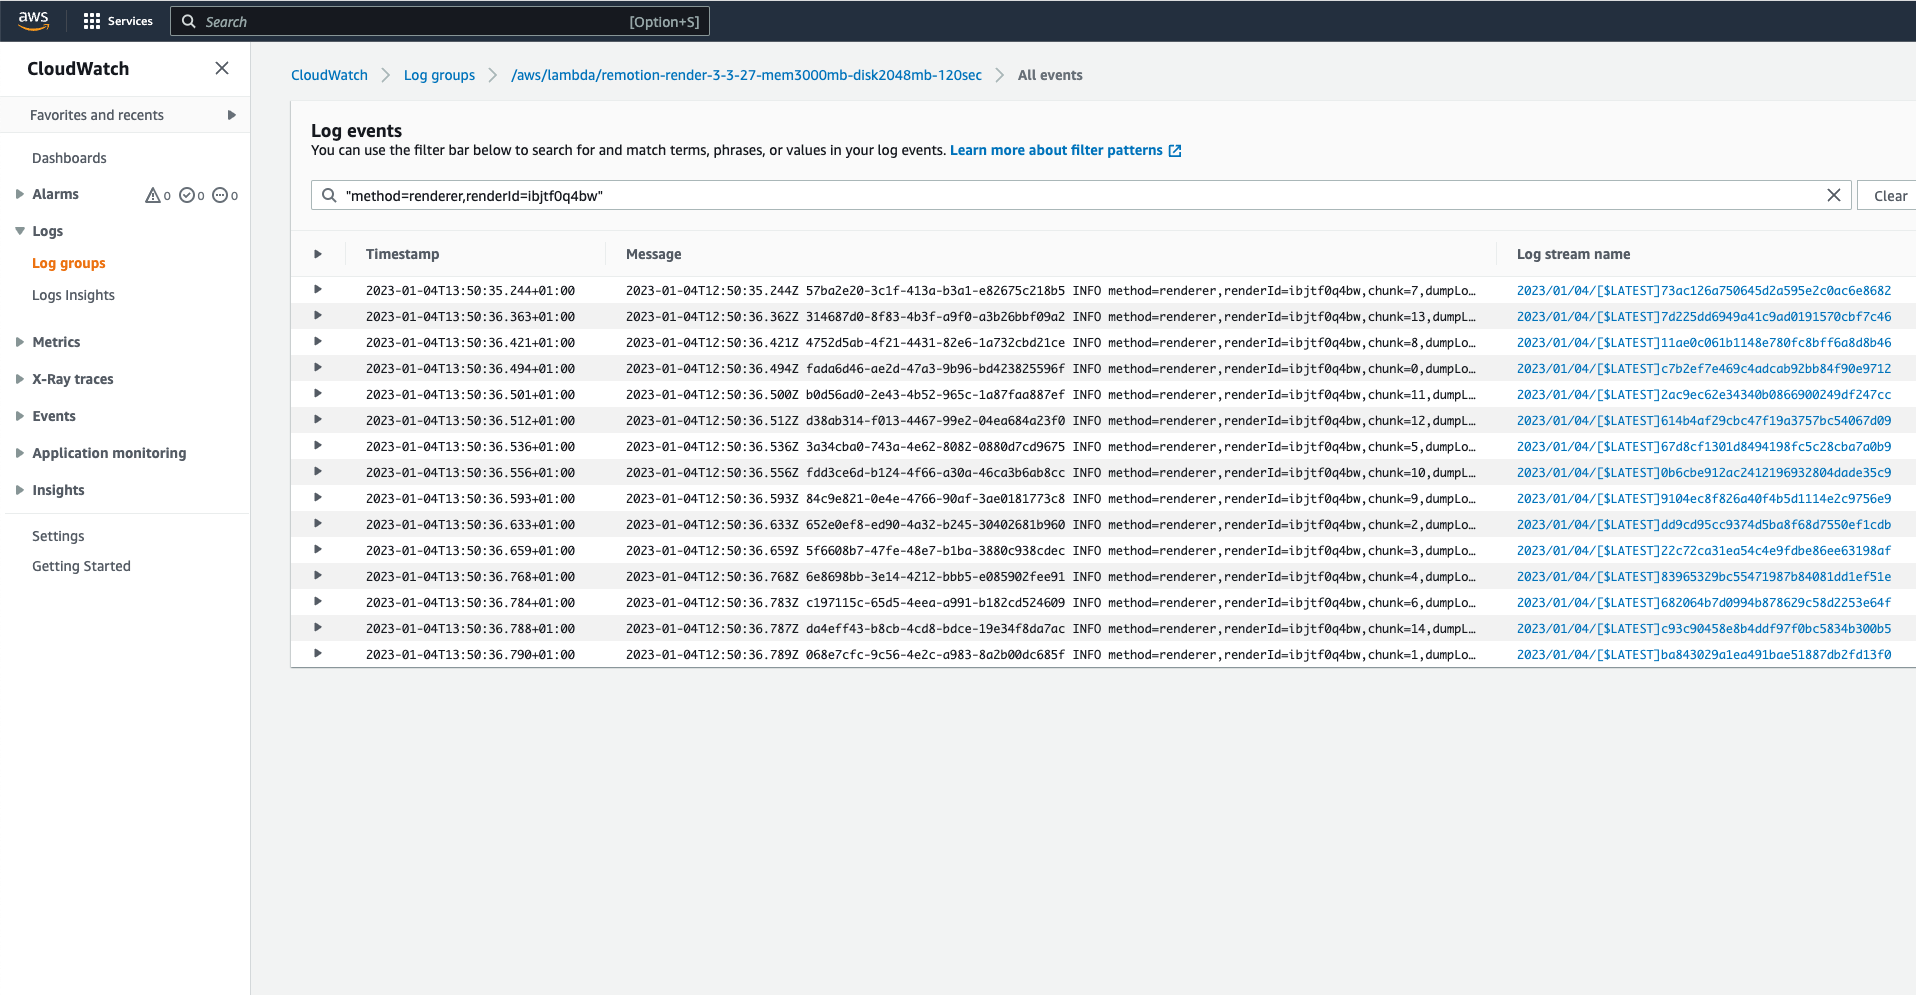
Open this link and log into AWS if needed. A log stream filtered after "method=renderer,renderId=[render-id]" will open.

Tweak the query to find the logs of a specific chunk: method=renderer,renderId=[render-id],chunk=12 will for example find the logstream of chunk 12. If your viewport is big enough, you will also see the chunk numbers in the summary view straight away.
Click the blue link in the Log stream name column to open the logstream. If you don't see any blue links, click "Display", then select "View in columns with details".
In the logstream, you will see debug logging from Remotion as well as any console.log statements from your React code.
Finding the chunk that failed
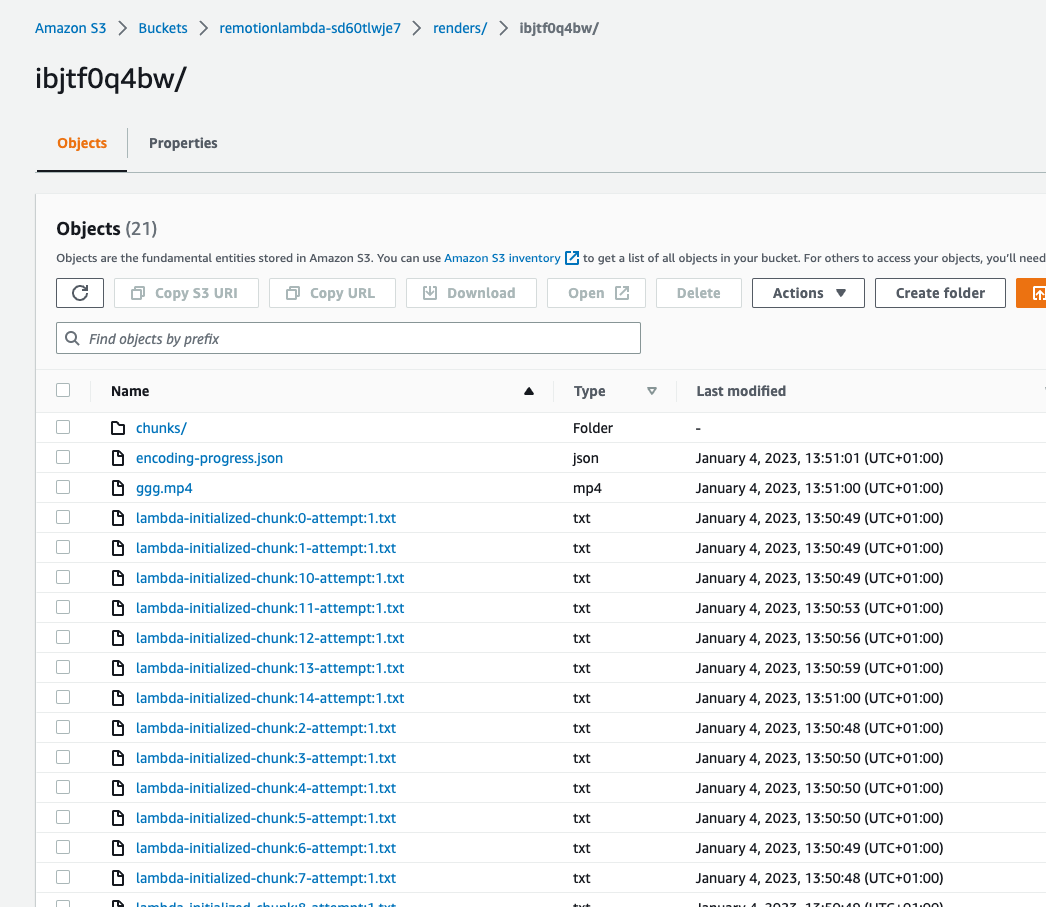
To find which chunks failed to render, add --log=verbose to the Lambda render while rendering via the CLI. Look for a log statement Render folder: to find the link to the render folder in S3.
When using renderMediaOnLambda(), you will get a folderInS3Console field in the return value.
After opening the link, open the chunks subfolder. Go through each existing chunk and find the ones that are missing. The missing chunks are the ones that failed to render.

After you've identified which chunks are missing, inspect the logs for that chunk to find the cause of the error.
Increasing the timeout
Note that two types of timeouts come into play in Remotion:
- The
delayRender()timeout. This is the timeout that is defined using--timeoutwhen callingnpx remotion lambda renderor usingtimeoutInMillisecondswhen callingrenderMediaOnLambda(). - The Lambda function timeout. This is the timeout that is defined using
--timeoutwhen callingnpx remotion lambda functions deployor usingtimeoutInSecondswhen callingdeployFunction().